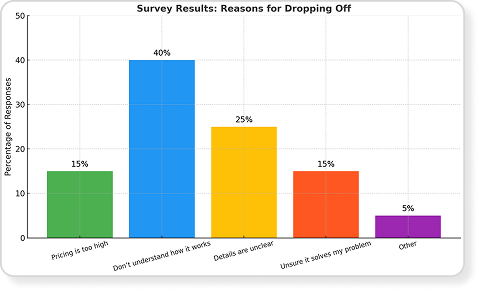
Survey - quantitative evidence
The core friction wasn't price - it was clarity and confidence. Users needed a clearer, guided explanation of how the platform works and how it could help them specifically.


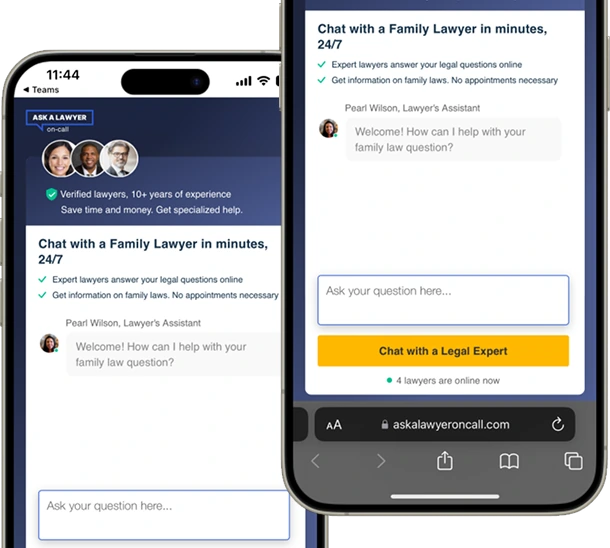
Making the next step clear to improve conversion
A redesign focused on helping users understand what happens after they start a conversation, reducing uncertainty and improving conversion.
Role
UX & UI Designer
Platform
Mobile
Outcome
Conversion increased from 7% -> 18.1%, while drop-offs reduced by 20%, based on 208,200 monthly visits.
Timeline
1 month
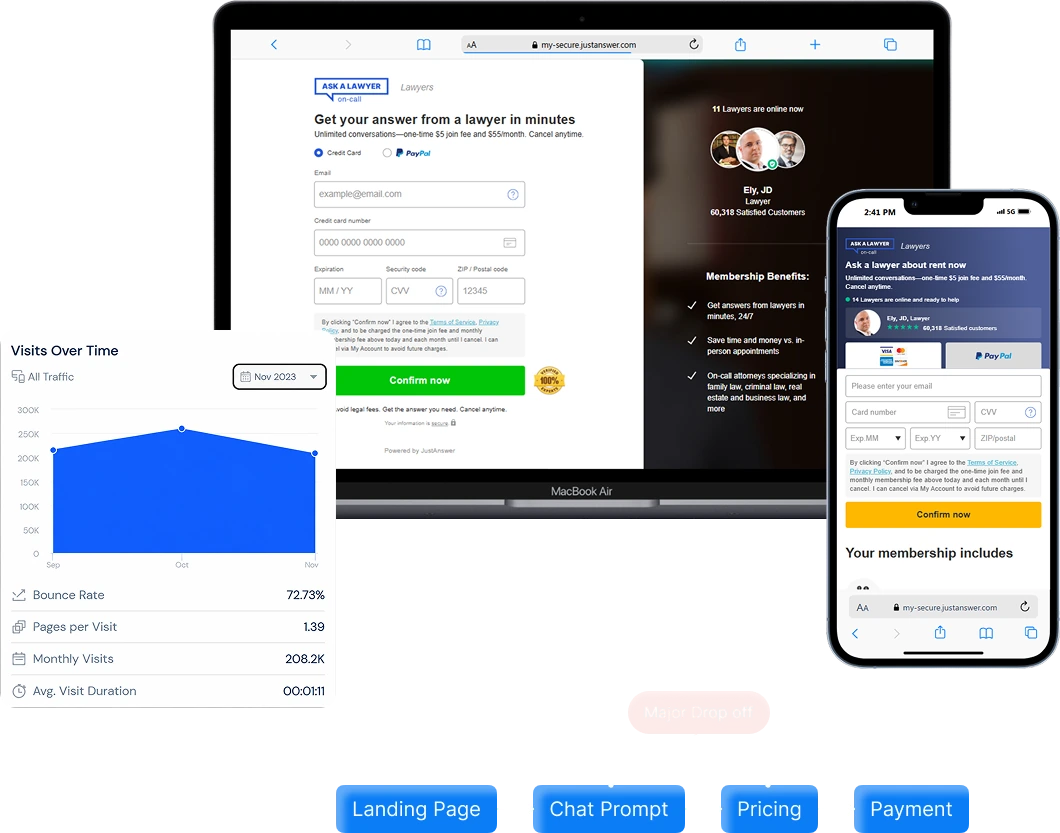
Landing page attracted 208,200 visitors in November 2023, averaging over 200,000 monthly visits.
The conversion rate during this period remained at 7%, equating to around 14,574 users completing their desired actions.
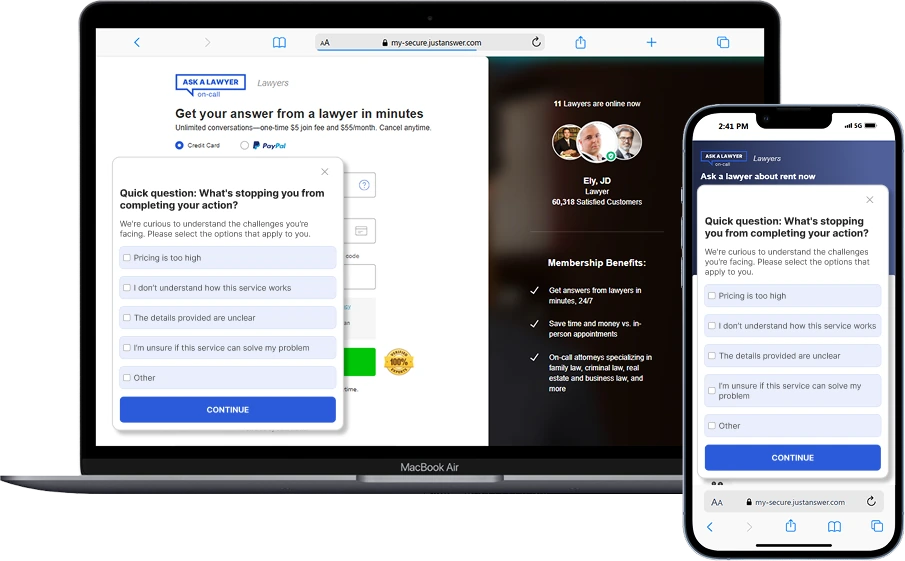
We combined quantitative survey responses with user interviews to understand where confidence and clarity were breaking down.
The core friction wasn't price - it was clarity and confidence. Users needed a clearer, guided explanation of how the platform works and how it could help them specifically.
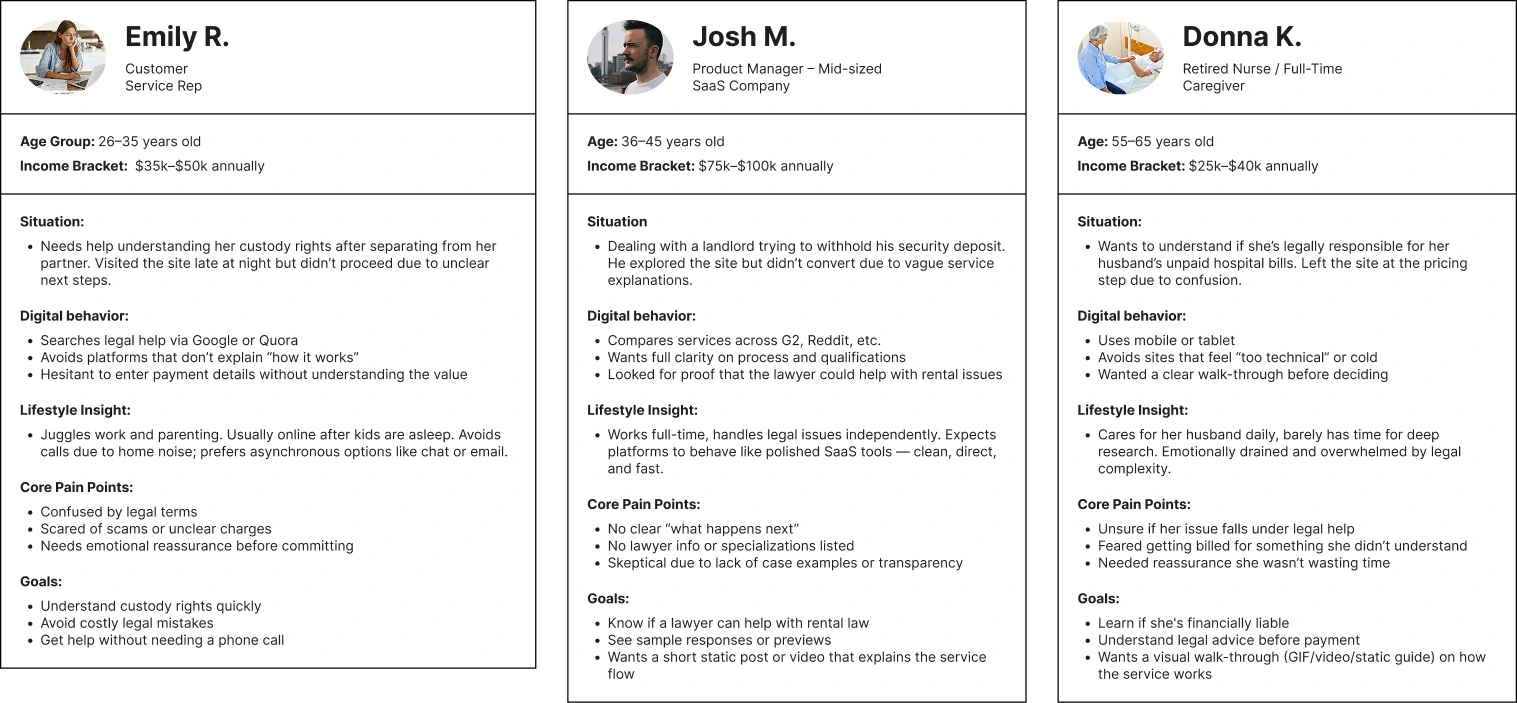
After analysing survey responses and user interviews, we identified 3 key user segments. I created these personas to represent their lifestyle, needs and pain points.
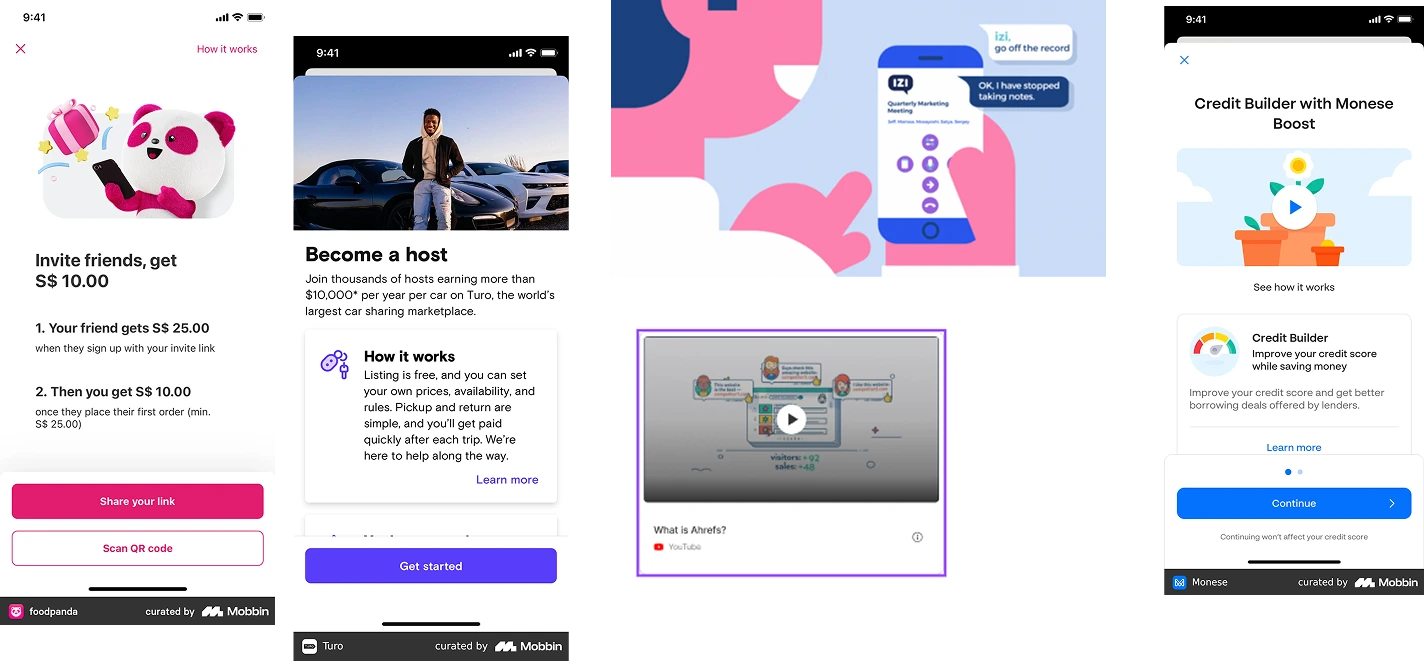
We reviewed how leading platforms explain their services, build trust, and guide users through the experience to identify patterns, gaps, and opportunities for Ask A Lawyer.
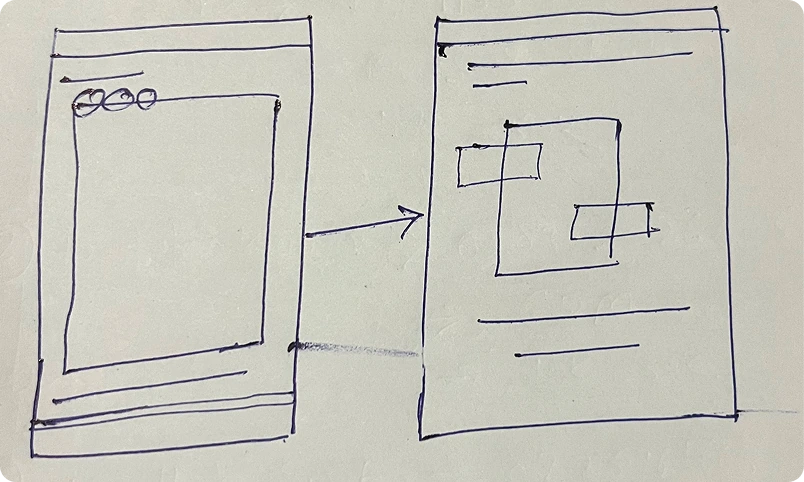
After analysing the survey findings and discussing them with the team, we decided to test three approaches for explaining the experience: a static guide, a GIF, and a short-form video. We aligned with product, UX, and engineering to balance user clarity, implementation feasibility, performance, and cognitive load, then created initial sketches for all three directions.
We explored 50+ ideas across static and GIF formats, testing different ways to make the experience clearer, more engaging, and easier to understand before narrowing down the strongest directions.
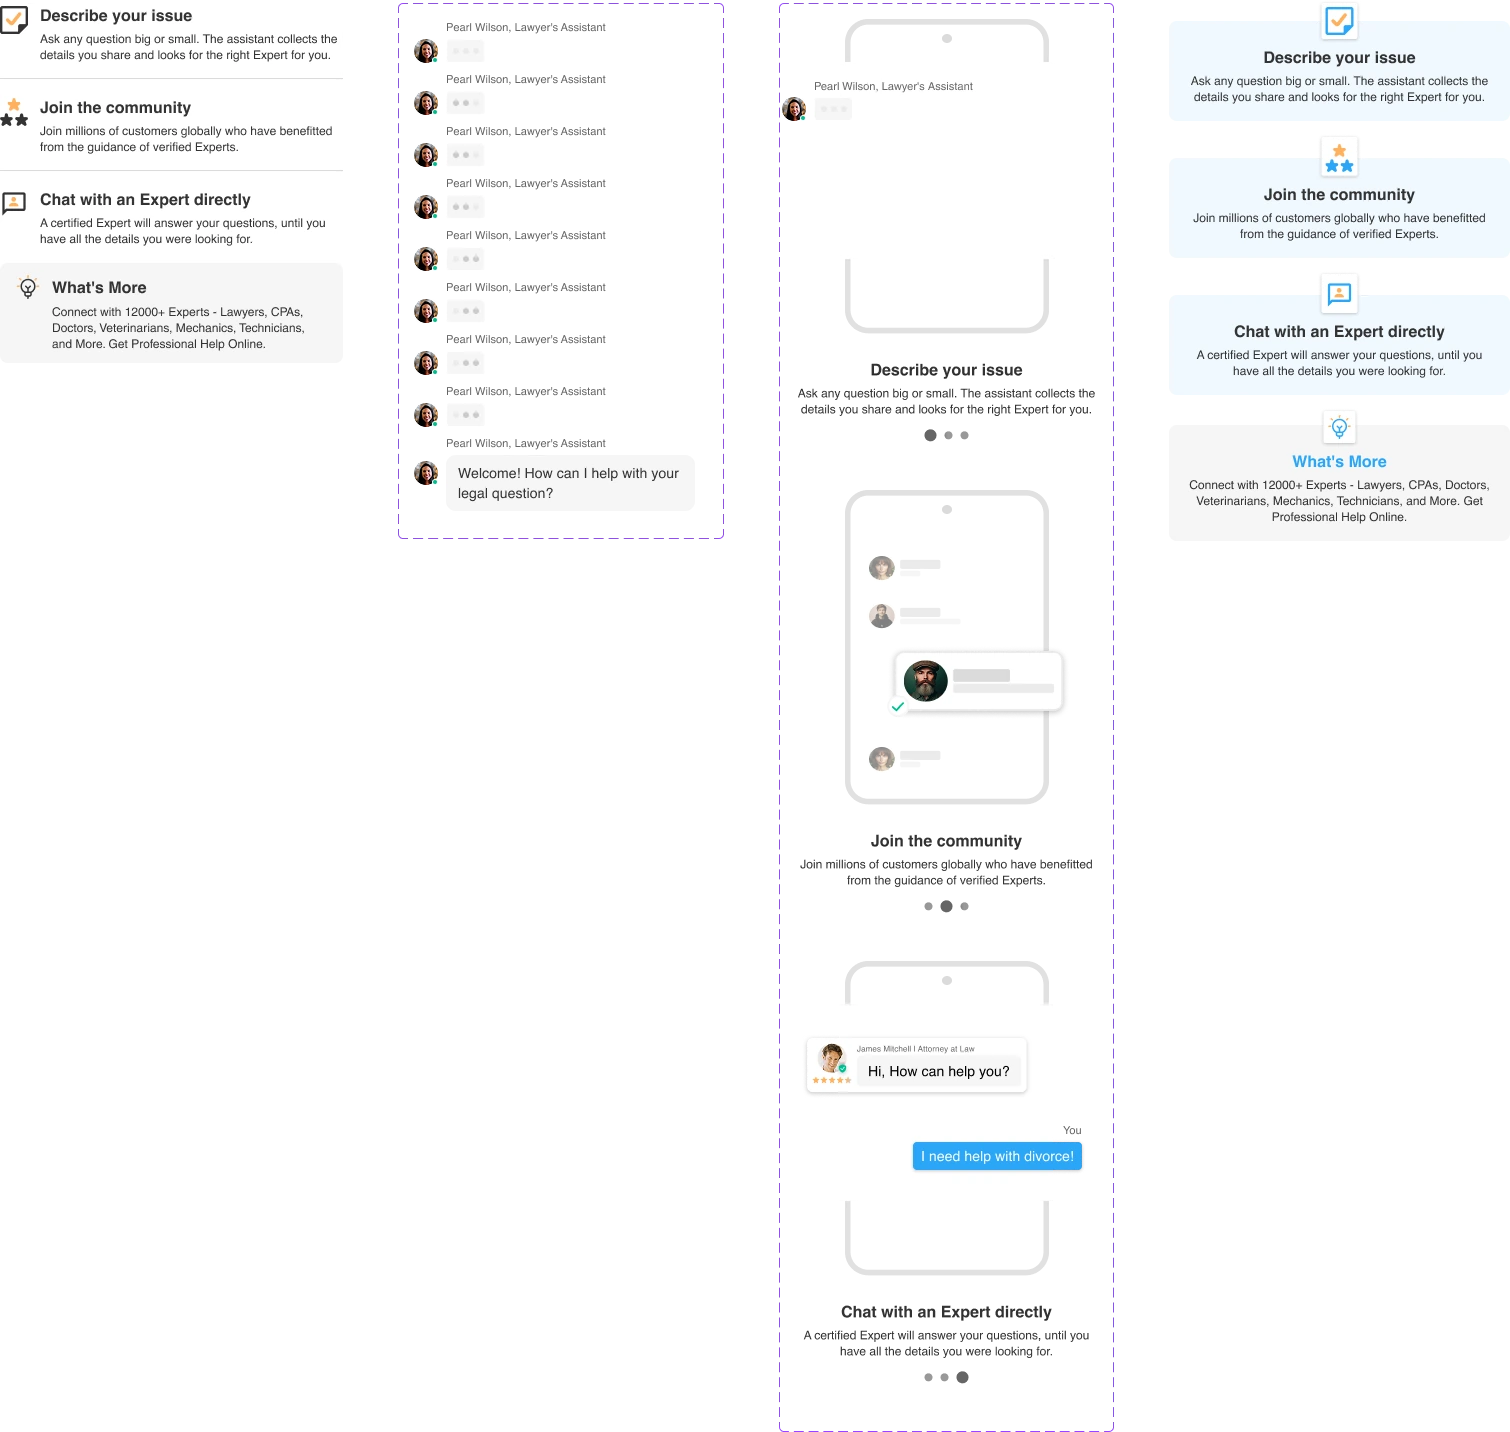

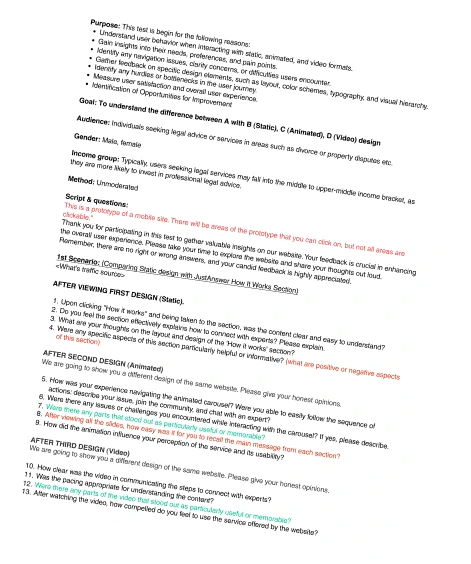
With the three directions ready, we prepared an unmoderated user test to understand which approach communicated the experience most clearly and confidently to users.
We tested all three directions with real users to understand which format communicated the experience most clearly, confidently, and effectively.
The static version performed best overall. Users found it clear, direct, and easy to understand, making it the most effective format for communicating the value proposition quickly.
The GIF created strong engagement, particularly among users aged 25-30 who enjoyed the visual flow and pacing. However, some users found it slightly distracting or less informative.
The video resonated more with users aged 60 and above who appreciated the detailed explanation. However, most users found it too long and were less likely to watch it through.
After identifying the strongest direction, we refined the design based on user feedback and tested the final experience in a real-world setting to validate the improvements.


After identifying the strongest direction through user testing, we validated the final experience in a real-world A/B test to measure its impact on conversion and determine which direction should move forward.
We compared the original experience with static and animated versions to understand which direction had the strongest impact on conversion.
| Version | Conversion Rate | Change vs. 7% Baseline |
|---|---|---|
| Original | 7.0% | - |
| Animated | 8.2% | +1.2 pp |
| Static | 18.1% | +11.1 pp |
Real-world A/B testing was conducted across approximately 8,000 users over one week.
The static version significantly outperformed the original experience, increasing conversion from 7% to 18.1%. Its clear, direct, and fast-loading experience made the value proposition easier to understand and act on.
The animated version showed some improvement over the baseline and generated stronger engagement among younger users, but it did not translate into a comparable conversion increase.
Key Insight
+158.6%
relative conversion uplift
The simplest direction performed the best.
The static experience delivered a 158.6% relative increase in conversion compared with the original 7% baseline, while the animated version delivered only a modest improvement.
Static became the default experience.
Based on the testing results, we moved forward with the static version as the primary experience. The animated direction remained available for context-specific use cases such as social or educational content.